/* V17: lower the cream process card so DECISION and ACTION remain unobstructed. */
Marketing Analytics × Programmatic Media

JENNIFER
IKHIDE

DATA → DECISION → OPTIMIZATION.
I use performance data to identify what isn’t working, make a strategic adjustment, measure the response — and optimize again.

JENNIFER IKHIDE / PORTRAIT
01 ↻CONTINUOUS
OPTIMIZATION
SIGNALDECISIONACTIONPERFORMANCEOPTIMIZE ↻
SIGNAL / 01
Find the pattern hiding inside the performance data.
7×CHURN LIKELIHOOD
TELECOM
SIGNAL → DECISION → ACTION → PERFORMANCE → OPTIMIZE ↻ — +111% FIRST-YEAR PROFIT GROWTH — $279M CUMULATIVE OPERATING PROFIT — 7× CHURN SIGNAL — +2.7 PTS MARKET SHARE — SIGNAL → DECISION → ACTION → PERFORMANCE → OPTIMIZE ↻ — +111% FIRST-YEAR PROFIT GROWTH — $279M CUMULATIVE OPERATING PROFIT —
01 / Independent Consumer Research · Research Design

THE BRAND
AWARENESS GAP.

What happens when a retailer evolves faster than the way consumers think about it? An independent research concept examining whether shoppers can identify Old Navy's current products without seeing the label.

Consumer InsightBrand PositioningQuantitative ResearchExperimental Survey Design

Images: Old Navy / Gap Inc. product and campaign imagery. Beauty Co. nationwide and online launch: August 26, 2026. Product and campaign imagery may change on linked retail pages.

01 / The observation

The products had changed. Had the mental picture?

While exploring Old Navy's current fashion direction and reported beauty expansion, I noticed a gap between what I expected the retailer to sell and what I was discovering. That raised a bigger question: was my awareness unusual, or might other relevant shoppers share the same blind spot?

Rather than assuming the repositioning had failed, I designed a way to measure awareness and brand attribution.

02 / Research question

Can consumers identify a brand beyond its established image?

Primary question: Is consumers’ average accuracy in attributing Old Navy’s current products to the brand lower than Old Navy’s own estimate of that recognition?

Research hypothesis (H₁): Average consumer attribution accuracy across Old Navy’s current product portfolio is lower than the recognition level estimated or assumed by the brand.

Null hypothesis (H₀): Average consumer attribution accuracy is equal to or higher than the brand’s estimated recognition level.

Testing requirement: A credible brand-side estimate or clearly identified benchmark is needed to evaluate this hypothesis. Without one, the study can report measured attribution accuracy but cannot establish that Old Navy overestimated it.

03 / Proposed research experience
01 / BASELINEMeasure category awareness and shopping habits.
02 / BLIND TESTAsk shoppers to attribute unbranded products to retailers.
03 / REVEALMeasure surprise, perceived fit and purchase consideration.
04 / Survey concept

Who would you expect to sell this?

Respondents would see standardized, unbranded photographs of real products from Old Navy and competitors. Brand choices and product order would be randomized to reduce guessing and order effects.

Illustrative question / 01Brand attribution
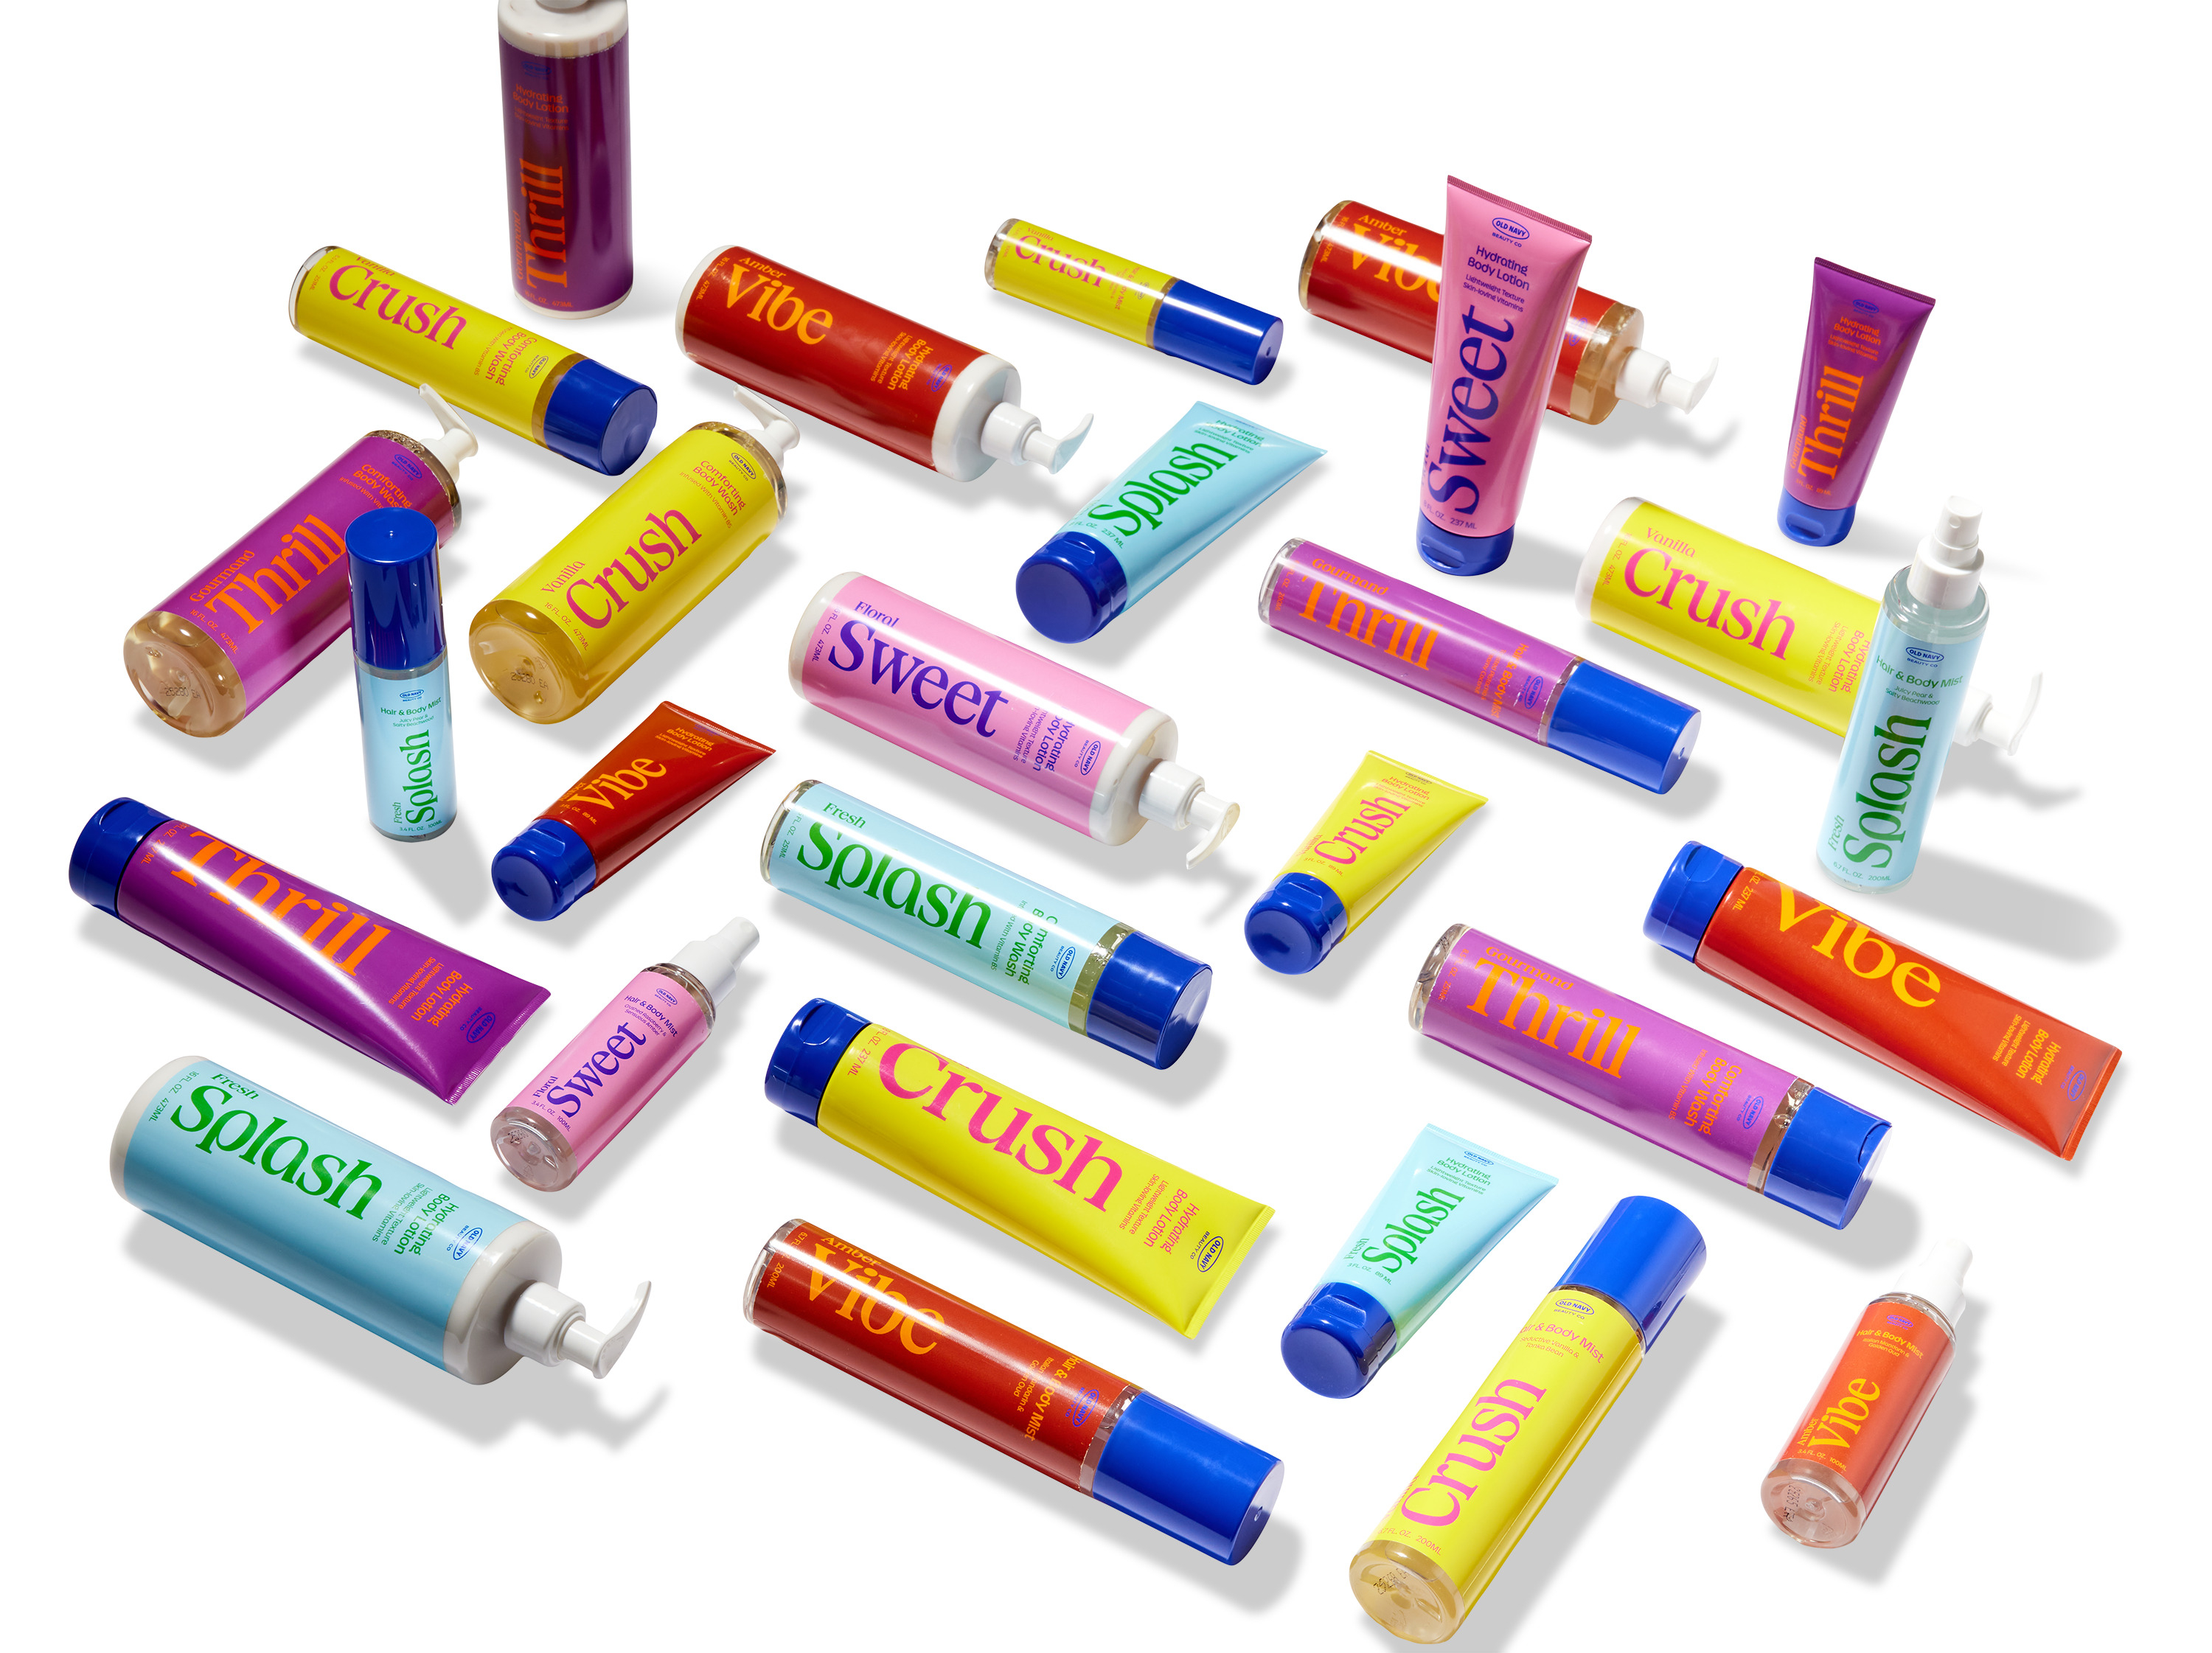
Old Navy Beauty Co Vanilla Crush body lotion, pictured with visible packaging for portfolio illustration
Old NavyH&MGapZaraTargetNot sure

Illustrative survey layout, not a live test. This editorial image retains branding; actual blind-test stimuli would have identifying packaging and logos obscured.

05 / Measurement strategy

Beyond asking “have you heard of it?”

Key measures

  • Awareness of actual product categories
  • Correct brand attribution by product category
  • Confidence in attribution (1–7)
  • Perceived brand–product fit (1–7)
  • Previous shopping and media exposure

Planned analysis

Descriptive awareness rates, category comparisons, chi-square tests and logistic regression. Repeated product responses would be accounted for rather than treated as independent observations.

06 / Why it matters

Distribution isn't the same as recognition.

For retailers and media planners, the study could reveal where product expansion and creative repositioning are not yet reflected in consumer expectations. Its implications extend to audience targeting, creative attribution, category education and the measurement of brand-building campaigns.

Project status: Independent research design and survey concept. No fieldwork results or statistical findings are claimed.

Role / Independently developed research question, conceptual framework, visual survey design, measurement plan and proposed analysis.

02
Global Cycling Retail / Growth & ROI Strategy

Finding the customer cohort and product levers to target 10% business growth.

A strategy and analytics project built from a cleaned global cycling-retail database of 112,036 orders. I isolated a high-value “Golden Cohort,” then translated the analysis into separate acquisition, pricing and volume strategies across bikes, accessories and clothing.

Growth Strategy · Customer Analytics · ROI Optimization
△
THE ANALYTICAL QUESTIONWhere is profit actually concentrated?

Rather than treating 112,036 global orders as one audience, I looked for the intersection of the customer and geographic variables associated with the strongest value.

THE GOLDEN COHORT LOGICBuild the target from overlapping signals.
AGE24–43Top-performing quartile
Peak CLV at 28, 29 & 34
GEOGRAPHYTop 25%13 key states / countries
High-CLV regions
GOLDEN
COHORT
53,500ORDERS
THE PAYOFF47% of orders → 51% of total profit

$16,350,435 in profit concentrated inside the cohort. That concentration became the basis for the growth strategy.

ANALYSIS FLOW112,036 orders→age performance→geographic CLV→intersection→product-line profit→growth levers
51.02%

Of total database profit
Generated by Golden Cohort

$10.81M

Bike profit inside cohort
Largest product driver

+10%

Expected business-growth
Mandate

ANALYZE / 01

Start with the cleaned 112,036-order database and compare customer value across age and geography rather than assuming the whole customer base behaves alike.

ISOLATE / 02

Identify ages 24–43 as the top-performing age band, then intersect it with the top 25% of geographies to form the Golden Cohort.

DECOMPOSE / 03

Break the cohort's $16.35M profit into product roles: bikes $10.81M, accessories $4.19M and clothing $1.34M.

ACT / 04

Use those roles to assign different levers: bike acquisition, accessory price-elasticity testing and clothing volume expansion.

OPTIMIZE ↻ / 05

Scale each lever only where the underlying cohort, regional order depth and product economics support it.

FROM ANALYSIS TO ACTION / THE EXECUTION BLUEPRINT

Turning a profitable cohort into three distinct growth opportunities.

Instead of presenting the 10% objective as a guaranteed outcome, I developed specific product, geographic and measurement recommendations—each designed to be tested against incremental contribution profit.

03 / Strategic interventions

Three product lines. Three different ways to grow.

Each lever responds to the economic role of its product category, with local market selection, an execution plan, and a test of whether it actually improves incremental profit.

Pillar I · Acquisition

Make bikes the hero product.

Revenue driver

With around $10.81M of profit in the target cohort, bikes represent the strongest commercial base. My proposal is not simply to run more ads: it is to concentrate spend around specific bike models in markets that already show strong acquisition potential, then measure the cost of generating genuinely incremental purchases.

1,000Target additional sales
1,400Target units sold
5 market areasInitial geographic focus
Proposed markets and productsBritish Columbia; Paris; Hamburg; North Rhine-Westphalia; Oregon. Featured models: Mountain 200 (Black & Silver), Road 350-W / 550-W (Yellow), and Touring 1000 (Blue & Yellow).

How I would execute

  • Build geographically segmented campaigns with distinct messages for each hero model.
  • Use high-intent search and product-specific creative to reach prospects actively comparing bikes.
  • Retarget qualified product viewers with model details, proof points, and relevant accessory bundles.
  • Shift spend toward markets with better contribution after acquisition costs—not simply cheaper clicks.

How I would prove it worked

  • Track incremental bike orders, units per order, new-customer acquisition cost, and contribution profit after media spend.
  • Compare test markets or matched audiences against a controlled baseline.
  • Pause or refine campaigns that grow revenue but fail to add enough profit.

The channel and experimentation details above are my proposed implementation framework; the original blueprint establishes the target products, markets, and sales goals, but does not report measured campaign results.

Pillar II · Margin optimization

Test selective accessory price increases.

Margin driver

Accessories accounted for approximately $4.19M of cohort profit. Instead of applying blanket price increases, I identified low-ticket products as candidates for controlled price elasticity tests, restricted to established high-order-volume markets.

Selected accessoryCurrent priceTest price
30 oz water bottle$5.00$5.70
Patch kit$2.00$2.85
Mountain tire tube$5.00$5.70
Sport-100 helmet$35.00$37.05
Eligibility rule and marketsLimit initial tests to regions with more than 2,400 established orders: New South Wales, Queensland, British Columbia, England, and Washington.

How I would execute

  • Randomize eligible customers or comparable markets into existing-price and test-price groups.
  • Separate standalone accessory orders from accessories purchased with bicycles.
  • Measure purchasing sensitivity by product, market, and customer segment.
  • Roll out only the price changes that improve contribution profit sustainably.

What would make the test successful?

  • Higher profit per eligible shopper, after accounting for changed conversion and unit sales.
  • No unacceptable deterioration in basket attachment, returns, customer satisfaction, or long-term retention.
  • Evidence that margin improvements persist beyond the first test window.

The original presentation includes modeled profit-uplift figures for these price scenarios. Those should not be interpreted as validated price-elasticity estimates or realized gains; unit economics and demand response must be verified through testing.

Pillar III · Demand expansion

Turn clothing into the volume engine.

Volume driver

Clothing generated roughly $1.34M in cohort profit, less than the other categories but with potential as an accessible entry purchase or add-on. I proposed a geographically focused promotional push designed to increase the number of items purchased and encourage repeat buying—not merely to discount products indiscriminately.

9,000Additional units targeted
620Additional orders targeted
8 regionsProposed deployment
Where to deployQueensland, Victoria, Paris, Hamburg, Hesse, North Rhine-Westphalia, Saarland, and Oregon.

How I would execute

  • Create regionally relevant clothing promotions and bundle opportunities aligned with existing bike customers.
  • Use post-purchase email, remarketing, and product recommendations to encourage second orders.
  • Test threshold-based offers against product-specific promotions to limit discount leakage.
  • Coordinate stock availability with local campaign intensity before expanding budgets.

How I would prove it worked

  • Incremental clothing orders, units per order, repeat purchase rate, and contribution margin.
  • Cross-category attachment rate, discount cost, and returns.
  • Holdout comparison to determine whether purchases were truly incremental rather than pulled forward.

The plan’s targets of 9,000 units and 620 orders are quoted from the source. They imply a high average number of units per additional order, so the unit/order definitions should be validated before they become formal operational commitments.

04 / From recommendation to execution

An experiment-led rollout, not an all-at-once launch.

The 10% net-profit growth objective becomes credible only when results are incremental, the interventions do not cannibalize one another, and additional spending is included in the economics.

PHASE 01 · BASELINE

Validate the opportunity

Reconcile sales, order, unit, and profit definitions. Confirm age/geography eligibility, product contribution margins, market volume, and seasonal trends. Set control groups and stop-loss thresholds.

PHASE 02 · PILOT

Test each lever independently

Run geographic bike acquisition pilots, controlled accessory price experiments, and targeted clothing offers. Observe conversion, order patterns, acquisition costs, and profit net of promotional expense.

PHASE 03 · SCALE

Allocate to demonstrated returns

Expand only the interventions with positive incremental contribution. Reallocate spend by market, guard against overlap and margin erosion, and review total business profit against the baseline.

Executive scorecard

Acquisition

Target: 1,000 bike sales / 1,400 units. Decision metric: incremental profit after customer acquisition costs.

Pricing

Target: profitable accessory price optimization in eligible high-volume markets. Decision metric: profit per visitor / eligible shopper.

Clothing

Target: 620 additional orders / 9,000 units. Decision metric: incremental contribution, adjusted for discounts and returns.

My analytical takeaway

The value of segmentation is not knowing who buys the most. It is knowing where a specific business intervention has the best chance of creating incremental profit.

This case study demonstrates strategic analysis, customer segmentation, geographic prioritization, product-level commercial thinking, experimentation design, and performance measurement.

Methodology & limitations. Source: Precision Growth Blueprint, 10-slide strategy presentation. The analysis used a reported cleaned dataset of 112,036 global orders. Cohort contribution is reported as $16,350,435 and 51.02% of profit; product contributions are rounded. Figures are historical descriptive analysis or strategic targets, not proof of realized campaign uplift. Additional activation mechanics and test design presented here expand the original recommendations and are explicitly proposals.
03
Telecommunications / Customer Churn Analytics

Which telecom customers were leaving — and what could retain them?

Analysis of 7,000+ customer records to identify who was most at risk, what was driving that risk, and where retention strategy should intervene.

Business Solutions & Marketing Analyst · Dataset Analysis
7×

Month-to-month customers
More likely to churn

0.037

Odds ratio
Two-year contract

309

Churned customers
Not accounted for by model

SIGNAL / 01

Month-to-month contracts, fibre optic service and electronic checks carried highest risk.

DECISION / 02

Prioritize Churn City, Churn Line VIPs and senior customers.

ACTION / 03

Contract promotion, more tech-support touchpoints and segment-triggered offers.

PERFORMANCE / 04

Longer tenure and support interaction were associated with sharply lower churn risk.

OPTIMIZE ↻ / 05

The unexplained churn gap becomes the next analytical problem.

04
Kelsey-White / Laundry Detergent Sales Brand / Brand Management Simulation

Growing a laundry detergent brand through data-driven pricing, product and audience decisions.

Kelsey-White was a simulated consumer-goods company, and “Blue” was its laundry detergent brand. As Brand Manager, I used customer, channel, pricing and competitor sales data to decide who to target, which detergent formats to prioritize, how to price the product and how to respond as market performance changed.

Laundry Detergent · Brand Manager · Simulation
BLUELAUNDRY
DETERGENT
WHAT WAS I SELLING?Laundry detergent.

Pods + liquid formats · odor elimination positioning · consumer household targeting · pricing and market-share optimization.

+111%

First-year profit growth
Optimized pricing + product mix

$279M

Cumulative operating profit
Across four years

+2.7 pts

Absolute market-share gain
Within 12 months

SIGNAL / 01

75% of profit from <$39,999 income; 70% from under-44s; 86% from 3+ households. Digital delivered 11.5M reach.

DECISION / 02

Prioritize younger, larger, value-conscious households and the strongest regions.

ACTION / 03

$7–$7.50 pricing, pods/liquid focus, odor-elimination USP and regional targeting.

PERFORMANCE / 04

$305M peak annual revenue and +111% first-year profit growth.

OPTIMIZE ↻ / 05

Pricing, product and competitive decisions culminated in +2.7-point share growth.

About / Jennifer Ikhide

Strategy is only the first decision.

I combine marketing analytics, consumer insight and creative strategy to understand performance — then use what the data says to sharpen the next move.

NYU — M.S. Integrated Marketing / May 2027
Programmatic Advertising · CRM · Statistical Measurement & Analytics
SAS Viya · SQL · SPSS · Advanced Excel · Tableau · GA4
The Trade Desk — Programmatic 101 Training Badge
Canva · Adobe Creative Suite · Figma